Showing posts with label CO2. Show all posts

Monday, November 10, 2014

Lies, Computer Models, and Government Subsidies


Updating Mark Twain's famous opinion that "Lies, Damned Lies, and Statistics" were three types of untruths, with "statistics" being the worst, I presented "Lies, Damned Lies, Computer Models, and Government Subsidies" to an astute audience at the Science-Technology Club at The Villages, FL, today. You may download the Powerpoint Show HERE.

COMPUTER MODELS ARE VERY USEFUL (BUT MAY BE MISUSED)

I generally love Computer Models, having produced several useful ones myself *. However, when it comes to the misuse of Climate Models to justify spending hard-earned taxpayer money for unworthy projects, my love has its limits.

I showed the attentive and interactive audience how I was able to model the latest NASA-GISS Global Land-Ocean Temperature Index using two sinusoids and one exponential. (See the graphic, above. The bright red line is the 5-Year Running Mean of the Temperature Anomaly in °C from 1880 through 2014. The blue and red sinusoids, representing natural cycles, have periods of 33- and 70-years, respectively, and the green exponential represents the increasing levels of "greenhouse" gases. Note how the thick black line, which is the sum of the sinusoids and the exponential, fairly closely matches the NASA-GISS Temperature Anomaly.)

Of course, the easy part of computer modeling is retro-dicting the past. As John von Neumann famously told Enrico Fermi, “With four parameters I can fit an ELEPHANT, and with five I can make him wiggle his trunk.”

The hard part is predicting the future, and I make no claims regarding my simplistic model's ability to do that. However, the IPCC (Intergovernmental Panel on Climate Change) and the rest of the Official Cliimate "Team" do take their models seriously. In the latest IPCC Assessment Report, they continue to predict a catastrophic future based on their failed models.

These models failed to predict the current 15- to 18-year "pause" in Global Warming, despite the increasing -even accelerating- levels of Atmospheric CO2. Furthermore, as Dr. Roy Spencer recently showed, only TWO out of 90 CMIP5 Climate Models, used in the latest IPCC Annual Report, agree with the OBSERVED SURFACE and LOWER TROPOSPHERE TEMPERATURE DATA.  Thus, over 95% of the IPCC models AGREE that, in Spencer's satirical words, "the OBSERVATIONS must be wrong" :^)

Climate Alarmists and Warmists have convinced the US, UK, and many other governments to spend tremendous amounts of taxpayer money to study the problem and to impose costly regulations to curtail human production of "greenhouse" gases.

The problem with attempts to model the Climate is that it is a combination of linear and chaotic elements, and the latter makes it virtually impossible to correctly predict the future beyond a relatively short period. See my PowerPoint Show for how I demonstrated that a chaotic model is very sensitive to initial conditions. Indeed, in my chaos model, a change in initial conditions of less than one part in a million, produced very large changes in longer-term results.

GOVERNMENT SUBSIDIES MAY BE USEFUL (IF NOT POLITICALLY ABUSED)

My talk concluded with a review of how necessary government spending, such as the vast expenditures on military aircraft during WWII and subsequent conflicts, may benefit industry and consumers, such as the commercial aircraft and airline industries. Similarly, the Space Program and Medical Research expenditures are mostly justified by the benefits they have brought to the taxpayers.

However, there is great danger when the government unnecessarily expends large sums and burdens industry and consumers with un-affordable costs for environmental purposes that are "justified" by failed Computer Climate Models.

For example:

Ethanol: The requirement that up to 15% Ethanol, derived from corn, must be blended with gasoline, despite higher costs and reduced MPG, appears to be a politically-motivated subsidy for the agricultural industry and states where corn is a major crop.

Solar Panels: US taxpayers lost $500M when solar-panel producer Solyndra went bankrupt. It appears that political influence was used in 2009 to push through a loan for them to produce solar panels in the US, despite the fact that their cylindrical technology cost several dollars per watt, as compared to flat panels available at less than a dollar per watt. They went bankrupt in 2011, only two years after the loan, and all employees lost their jobs.

There are many other examples, too numerous to mention!

Ira Glickstein

*COMPUTER MODELS BUILT BY IRA
• “Nash Bargain” Advisor Click for:  DESCRIPTION   FREE SPREADSHEET 

• Management Span of Control Advisor Click for:  DESCRIPTION   FREE SPREADSHEET 

• Visual Acuity Advisor Click for: DESCRIPTION   FREE SPREADSHEET 

• Bayesian Inference/Analysis Advisor Click for: DESCRIPTION   FREE SPREADSHEET
• Decision Aiding Model – “Trade Study” Click for:  DESCRIPTION FREE SPREADSHEET


Wednesday, April 16, 2014

Global Warming in Perspective

GLOBAL WARMING IS REAL, BUT NOT A BIG DEAL


1) Some of the net Global Warming since 1880 is undoubtedly due to human actions. The Atmospheric "Greenhouse" Effect is real and water vapor (H2O) and carbon dioxide (CO2) are "greenhouse" gases.
2) The actual temperature rise and human responsibility for it have been exaggerated.  By their repeated and substantial "adjustments" to the US temperature record, the Official US Climate Team (NASA GISS) has admitted that it is unreliable.
3) Official Climate Theory is flawed because it is "handcuffed" to CO2 levels. None of the official Climate Models predicted the current 17-year "pause" in warming. CO2 levels continue to rise rapidly, but the predicted warming has not occurred. 

 I posted some of this material on 7 April at Watts Up With That, the world's most viewed climate website. In the first two days, it received almost five thousand page views and almost a hundred comments. Some commenters found my first chart confusing. The image above is a simplified version. I also presented some of this material to the "Civil Discourse Club" at the Colony Recreation Center in The Villages, FL on 7 April, and again at the Savannah Recreation Center on 14 April, with over 100 people at each venue. My PowerPoint Show is available for download: here

Going from left to right on the above graphic:

Atmospheric “Greenhouse” Effect, responsible for about 59°F (33°C) warming. This is the Natural Process that makes life on Earth as we know it possible. The mean temperature on the surface of the Earth is about 59°F (33°C) warmer due to Atmospheric absorption of long-wave radiation by "greenhouse" gases, and the subsequent "back-radiation" of some of this heat energy towards the Earth surface. (See my WUWT Visualizing series [Physical Analogy, Atmospheric Windows, Emission Spectra, and Molecules/Photons Light and Heat])

Ice Age Warming and Cooling, are Natural Cycles that have occurred about every 100,000 years according to the ice core records from the past 400,000 years. Since these cycles occurred well before humans appeared on Earth, they must be entirely natural. The climate is always changing, with up and down temperature jigs and jags at all time scales. The major Ice Age Cycles change temperatures over a range of about 13°F (7°C ).

Mean Global Warming Since 1880, According to the Official NASA GISS and IPCC Accounting, is 1.4°F (0.8°C). According to the IPCC, the majority of this Global Warming is due to human activities (mainly unprecedented burning of fossil fuels and land use that has reduced the albedo of the Earth). I have interpreted "majority" to mean about 70% and have therefore allocated 1°F (0.6°C) to Human-Causation and the remaining 0.4°F (0.2°C) to Natural Cycles.

Please notice that the Human-Caused warming is a minor uptick in temperature compared to the variations due to the Natural Cycles of Ice Age warming and cooling and the major Natural Process warming due to the Atmospheric "Greenhouse" Effect!

Even that small amount of warming is most likely exaggerated and NASA GISS and the IPCC have the proportion of human-caused and natural backwards. Actual warming is most likely about 1.0°F (0.6°C), with about 0.8°F (0.5°C) due to Natural Cycles, and the remaining 0.2°F (0.1°C) due to Human-Causation. 


Move from New York to Florida, My wife and I experienced considerable warming when we retired from full-time employment and moved from Upstate New York to Central Florida. The average temperature in Florida is about 20°F (11°C ) warmer than that in New York. While not exactly "Global" Warming, this warming was certainly due to our Human-Caused decision to move south, and, of course, we enjoy the resulting moderately higher temperatures :^). Our voluntary move caused many times more degrees of warming than the global warming since 1880!
Yearly and Daily Warming and Cooling:  Natural Cycles of the YEARLY 43°F (24°C ) temperature range in Central Florida (July mean minus January mean), and Natural Cycles of the DAILY 19°F (11°C ) temperature range we experience here. Please notice that these ranges are much larger than the Natural Cycles of the Ice Ages, and they recur on a daily or yearly basis in the temperate zones of the Earth. Again, these daily and yearly temperature cycles cause many times more degrees of warming and cooling than all the global warming since 1880!


THE OFFICIAL TEMPERATURE RECORD IS UNRELIABLE


The blink chart below illustrates how US thermometer data from the early 1900's to 1998 has been "adjusted" by NASA GISS to COOL DOWN data prior to the 1970's and WARM UP data after the 1970's. Please note that 1998, the warmest year of the 1990's, is now shown as warmer than 1934, the warmest year of the 1930's. When the same chart was originally published in 1999 by the same US-government-supported institute, the relationship was reversed. The net change in this relationship is 1.154°F (0.641°C). Both charts were downloaded in March 2014 from http://www.giss.nasa.gov/ 


We know that the US thermometer record is so unreliable that it has had to be "adjusted" several times by the official US Climate "Team" at GISS, see The Past is Not What it Used to Be, and Skeptic Strategy. and Climate Change Controversy.

Unless we believe that the world temperature record is more reliable than the US record, it is likely the world record has also been similarly "adjusted". Therefore, I have discounted the GISS estimate of Global Warming by about 30%, so actual warming is about 1.0°F (0.6°C). I believe the IPCC has over-estimated Climate Sensitivity by a factor of two or three, so I have allocated the majority of the warming 0.8°F (0.5°C) to Natural Cycles, and the remaining 0.2°F (0.1°C) to Human-Causation.

PLEASE NOTE: I do not claim that the "adjustments" are wrong, only that the underlying temperature data is unreliable. If that data was reliable, there would be no need for the repeated re-analysis and "adjustments" that have been done by the official Climate Team.

OFFICIAL CLIMATE MODELS HAVE FAILED

We have had good satellite records of Global Temperatures since 1979, so we no longer need to rely on the unreliable terrestrial temperature record. As shown in the chart below, the satellite record (blue arrows) shows moderate warming from 1979 to about 1996, and then a "pause" in warming that continues to this day. The wiggly lines on the chart show the theoretical Climate Models, with the heavy red line (and the red arrow) indicating the average of all the models. All of the official Climate Models have failed because the underlying Climate Theory is flawed.


Climate Sensitivity is the Mean Temperature Rise expected if CO2 levels double. So far, from 1979 to the present, CO2 has increased from about 330 ppmv to nearly 400 ppmv, a 40% rise. If that rate of CO2 rise continues, as it almost certainly will given the rapid industrialization of China, India, and other countries, the 1979 CO2 level will double by 2060.
 

The IPCC claims Climate Sensitivity is in the range of 2.7°F (1.5°C) to 8.1°F (4.5°C), and their Climate Models reflect that range. As the chart above indicates, when their Climate Models are run from 1979 to 2013, the expected temperature rise is about 1.6°F (0.9°C) . However, the actual temperature rise since 1979 is only about 0.3°F (0.17°C) , a fraction of what was predicted!

Based on the evidence of this chart, that the IPCC has over-estimated Climate Sensitivity by at least a factor of two to three.  I believe actual Climate Sensitivity is closer to the range of 1.0°F (0.6°C) to 2.0°F (1.1°C).


THE SCIENTIFIC METHOD vs THE OFFICIAL CLIMATE THEORY
As Richard Feynman famously said,

It doesn't matter how beautiful your theory is. It doesn't matter how smart you are. If it doesn't agree with experiment it is wrong!
The Official Climate Theory is based on a gross over-estimate of CO2 Climate Sensitivity. Reliable satellite-based temperature DATA since 1979 proves that the Official Climate Theory is WRONG by a factor of at least two or three.

According to the Scientific Method, if your theory doesn't agree with the observational DATA, you need to change your THEORY.

The Official Climate Team seems to have changed the DATA!


Ira Glickstein 


Thursday, January 9, 2014

Global Warming - REAL, but NOT a Big DEAL

[UPDATE: I reposted this at WUWT, the most viewed Climate website in the world, and have over 10,000 page views and 230 comments.]
We've reached a turning point where it is hard for any Global Warming Alarmist to claim (with a straight face) that the world as we know it is about to end in a decade or two or three unless we stop burning fossil fuels. Anyone deluded or foolish enough to make such a claim would be laughed at by many audiences.

GLOBAL WARMING IS REAL

Yes, the world has warmed 1°F to 1.5°F (0.6°C to 0.8°C) since 1880 when relatively good thermometers became available. Yes, part of that warming is due to human activities, mainly burning unprecedented quantities of fossil fuels that continue to drive an increase in carbon dioxide (CO2) levels. The Atmospheric "Greenhouse" Effect is a scientific fact!

BUT GLOBAL WARMING IS NOT A BIG DEAL

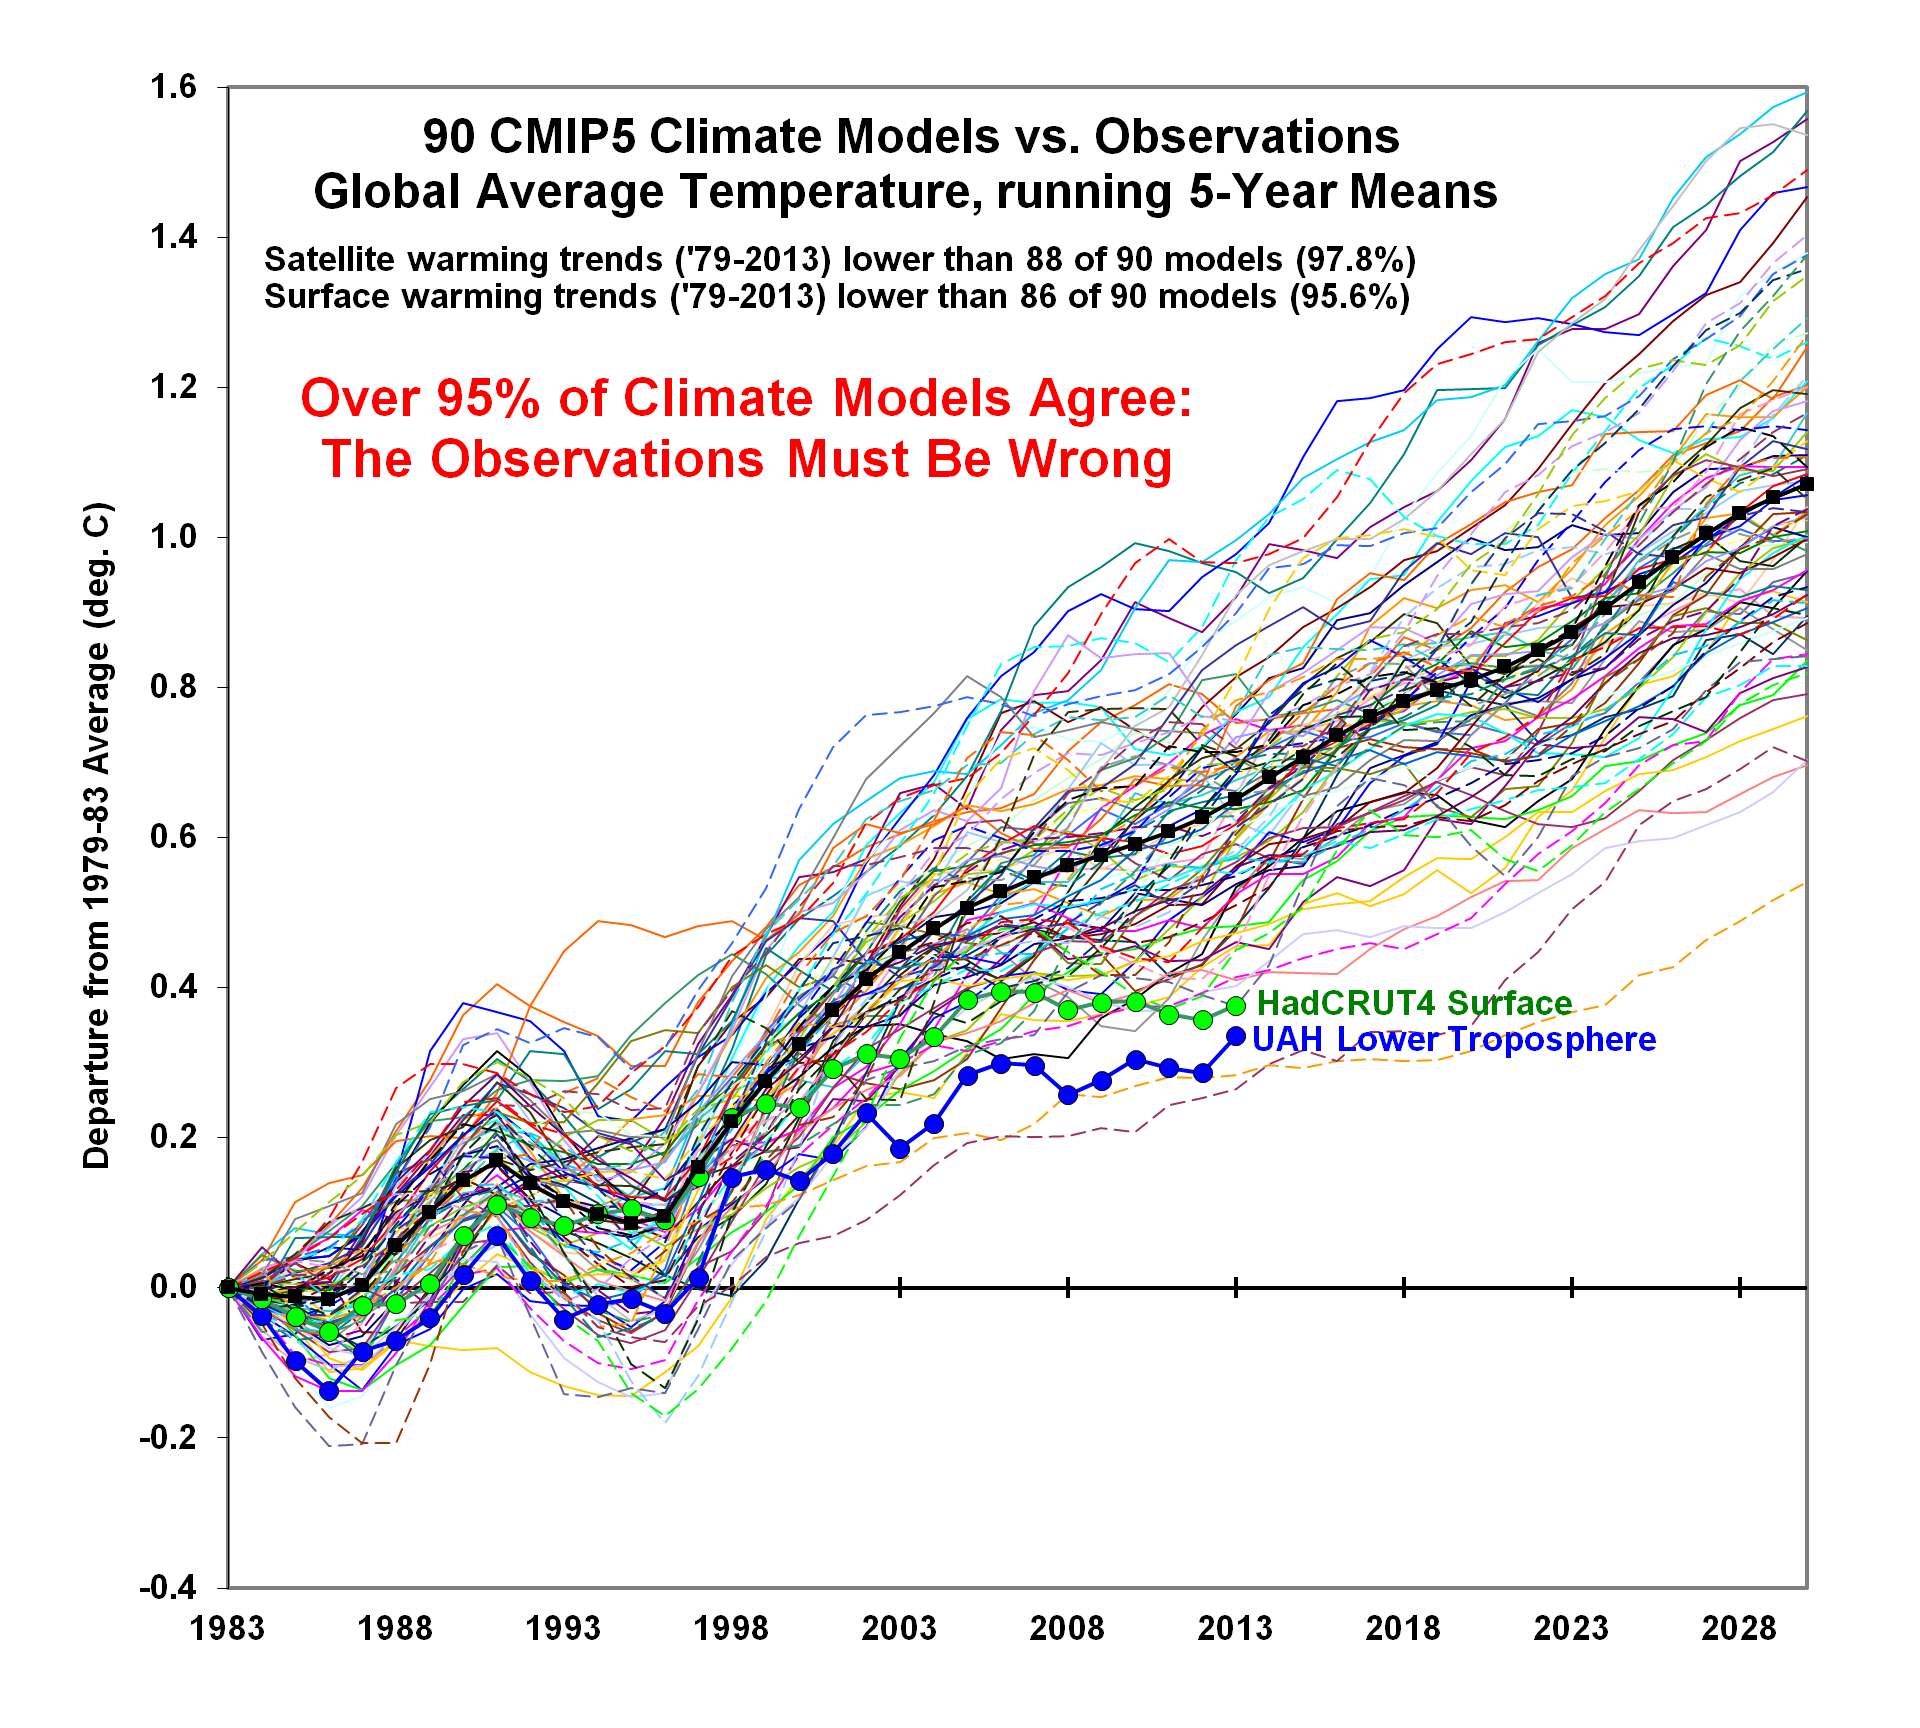
As the animated graphic clearly indicates, the theoretical climate models used by the Intergovernmental Panel on Climate Change (IPCC) are handcuffed to inordinately high estimates of climate sensitivity (how much temperatures are expected to rise given a doubling of CO2). Since the advent of good satellite-based global temperature data in 1979, observed temperatures have risen at a fraction of the IPCC predicted rate even as CO2 continues to rise. Relax, there is not and never has been any near-term "tipping point". The actual Earth Climate System is far less sensitive to CO2 than claimed the IPCC climate theory, as represented by their computer models. Global Warming since 1880 is mainly due to Natural Cycles and Processes not under human control. Yes, the same Natural Cycles and Processes that were responsible for the many Ice Age cycles that repeatedly occurred about every 100,000 years or so.

MY JANUARY 2014 PRESENTATION 

By a stroke of good fortune, last week I was scheduled to present "Visualizing the Atmospheric 'Greenhouse' Effect - Global warming is real, but how much is due to human activities and how big is the risk?" to the Philosophy Club in the Central Florida retirement community where I live. This is a great time for Global Warming Skeptics to put the Alarmists in their place.

Everyone in the highly interactive and supportive audience was aware of newspaper and TV reports of the drama of those ill-fated Global Warming "Research" activists whose Russian ship, the Academik Shokalskiy, got stuck in the summer ice of the Antarctic. (Fortunately, those people are safe, having been rescued by a helicopter from a Chinese icebreaker.) In addition to the Antarctic adventure gone wrong, in the week leading up to and following my talk, the media was overrun by stories of the "polar vortex" literally freezing large parts of the US and even causing Florida temperatures to drop below 30°F.

Of course, we realize that the cold wave is only anecdotal evidence and "weather is not climate". However, photos and videos of researchers stuck in the Antarctic summer ice as well as scenes of American life frozen in place for days on end, when combined with clear and irrefutable evidence of a slowdown in warming since 1979 and no statistically significant warming since 1996 (as depicted in the graphic above), has considerable emotional impact.

My animated PowerPoint Show, which should run on any Windows PC, is available for download here. (NOTE: I knew that many members of The Philosophy Club audience, while highly intelligent and informed, are not particularly scientifically astute. Therefore, I kept to the basics and  invited questions as I proceeded. Since most of them think in Fahrenheit, I was careful to give temperatures in that system. By contrast, my 2011 talk to the more scientifically astute members of our local Science and Technology Club Skeptic Strategy for Talking about Global Warming was more technical. Both presentations make use of animated PowerPoint charts and you are free to download and use them as you wish.)

My presentation is based on my five-part series for the most viewed climate website in the world, "Watts Up With That" (WUWT) where I am a Guest Contributor. The series is entitled "Visualizing the 'Greenhouse Effect'" - 1 - A Physical Analogy, 2 - Atmospheric Windows, 3 - Emission Spectra, 4 - Molecules and Photons, and 5 - Light and Heat.  The series, which ran in 2011, generated tens of thousands of page views at WUWT, along with thousands of comments.

I wrote the series because WUWT is a "skeptic" website and attracts some viewers who reject the basic physics of the Atmospheric "Greenhouse" Effect. (The owner of WUWT, Anthony Watts, like me, accepts the basic physics and the fact that some of the warming of the past century is indeed due to human activities, such as unprecedented burning of fossil fuels that have raised CO2 levels. However, we are skeptical about how much the Earth Surface has actually warmed, and how big a risk is posed by moderate increases in CO2 and temperature.)

HOW A REAL GREENHOUSE WORKS

I explained how a real physical Greenhouse works and how that is both similar and different from the Atmospheric "Greenhouse" Effect. The Greenhouse descriptions I learned in high school, as well as those available on the Internet, consider only the RADIATIVE effect. The glass roof of the Greenhouse allows visible light to pass through freely, heating the soil, plants, and air, but is opaque to the resultant infrared radiation, which is partly re-radiated back down into the Greenhouse, warming it further.  That part is true, but far from the whole story. The MAIN reason a Greenhouse stays warm is that it is airtight to restrict CONVECTION and it is insulated to restrict CONDUCTION. In fact, it is possible to construct a successful Greenhouse using a roof made from materials that allow both visible and infrared to pass freely, but is impossible to make a working Greenhouse that is not both airtight and insulated.

HOW THE ATMOSPHERIC "GREENHOUSE" EFFECT WORKS

All warm objects emit radiation at a wavelength dependent upon the temperature of the object. The Sun, at around 10,000 °F, emits "short-wavelength" infrared radiation, centered around 1/2 micron (one millionth of a meter). The soil, plants, and air in the Greenhouse, at around 60 to 100 °F, emit "long wavelength" radiation, centered around 10 microns (with most of the energy between 4 and 25 microns).   

The Atmospheric "Greenhouse" Effect works because:
  1. Short-wavelength radiation from the Sun passes freely through the gases that make up  the Atmosphere,
  2. About a third of this Sunlight is reflected back by white clouds, dust, and light-colored objects on the Surface, and that energy is lost to Space,
  3. The remaining two-thirds of  the Sunlight energy is absorbed by the Sea and Land Surface and causes it to warm,
  4. The warm Surface cools by emitting long-wavelength radiation at the Bottom of the Atmosphere, and this radiation passes towards the Top of the Atmosphere, where it is ultimately lost to Space,
  5. On the way to the Top of the Atmosphere, much of this radiation is absorbed by so-called "Greenhouse" gases (mostly water vapor and carbon dioxide) which causes the Atmosphere to warm,
  6. The warmed Atmosphere emits infrared radiation in all directions, some into Space where it is lost, and some back towards the Surface where it is once again absorbed and further warms the Surface.
  7. In addition to the RADIATIVE effects noted in points 1 through 6, the Surface is cooled by CONVECTION and CONDUCTION (thunderstorms, winds, rain, etc.)
THANK GOODNESS OR THE ATMOSPHERIC "GREENHOUSE" EFFECT

If not for the warming effect of "Greenhouse" gases, the Surface of the Earth would average about -1 °F, which would prevent life as we know it. This effect is responsible for about 60 degrees F of warming.

According to the Intergovernmental Panel on Climate Change (IPCC), the Earth Surface has warmed about 1.5 °F since good thermometer data became available around 1880. Some skeptics (including me) believe the actual warming is closer to 1 °F, and that government agencies have adjusted the thermometer record to exaggerate the warming by 30% or more.

However, it doesn't really matter whether the actual warming is 1 °F or 1.5 °F because we are arguing about only 0.5 °F, which is less than 1% of the warming due to the Atmospheric "Greenhouse" Effect.

HOW SENSITIVE IS THE CLIMATE TO HUMAN ACTIVITIES?

The IPCC claims that the majority of the warming since 1880 is due to human activities. It is true that we are burning unprecedented amounts of fossil fuel (coal, oil, gas), and that we are making land use changes that may reduce the albedo (reflectiveness) of the Surface. Most of the increase in Atmospheric CO2 (a 40% rise from about 270 to nearly 400 parts per million by volume) is due to human activities.

The IPCC claims that Climate Sensitivity (the average increase in Surface temperatures due to a doubling of CO2) is between 3 °F and 8 °F.  Some skeptics (including me) believe they are off by at least a factor of two, and possibly a factor of three, and that Climate Sensitivity is closer to 1 °F to 3 °F.

As evidence for our conclusions, we point to the fact that virtually ALL of the IPCC climate models have consistently over-estimated future temperature predictions as compared to the actual temperature record. Indeed, for the past 17 years as CO2 levels continue their rapid climb, temperatures have leveled off, which is proof that Natural Cycles, not under human control or influence, have cancelled out warming due to CO2 increases. Thus, Natural Cycles must have a larger effect than CO2.

VISUALIZING THE ATMOSPHERIC "GREENHOUSE" EFFECT

As I noted above, I wrote the "Visualizing" series for WUWT (1 - A Physical Analogy, 2 - Atmospheric Windows, 3 - Emission Spectra, 4 - Molecules and Photons, and 5 - Light and Heat) because some WUWT viewers are "Disbelievers" who have had an "equal and opposite" reaction to the "end of the world" excesses of the Global Warming "Alarmists".  By failing to understand and accept the basic science of the Atmospheric "Greenhouse" Effect, they have, IMHO, "thrown the baby out with the bathwater".

1 - A Physical Analogy

Albert Einstein was a great theoretical physicist, with all the requisite mathematical tools. However, he rejected purely mathematical abstraction and resorted to physical analogy for his most basic insights. For example, he imagined a man in a closed elevator being transported to space far from any external mass and then subjected to accelerating speeds. That man could not tell the difference between gravity on Earth and acceleration in space, thus, concluded Einstein, gravity and acceleration are equivalent, which is the cornerstone of his theory of relativity. Einstein never fully bought into the mainstream interpretation of quantum mechanics that he and others have called quantum weirdness and spooky action at a distance. He had trouble accepting a theory that did not comport with anything he considered a reasonable physical analogy!

So, if you have trouble accepting the atmospheric “greenhouse” effect because of the lack of a good physical analogy, you are in fine company.

Well, getting back to the Atmospheric "Greenhouse Effect, a "disbelieving" commenter on WUWT, suggested we think of the Sunlight as truckloads of energy going from the Sun to the Earth Surface, and the infrared radiation from the Surface as equal truckloads going the other way. How, he asked, could these equal and opposite truckloads do anything but cancel each other out as far as the amount of energy on the Surface of the Earth? In reply, I posted a comment with an analogy of truckloads of orange juice, representing short-wave radiation from Sun to Earth, and truckloads of blueberry juice, representing longwave radiation between Earth and the Atmosphere and back out to Space.

That thought experiment triggered my creativity. I imagined the Sun as a ball-pitching machine, throwing Yellow balls towards the "Earth" Surface (representing short-wave radiation) and Purple balls (representing long-wave radiation) bouncing back towards Space and interacting with the Atmosphere. The graphic below is one of my depictions of the physical analogy. Follow this link for more graphics and detail.


I imagined the Earth as a well-damped scale. The Yellow balls would bounce off the Surface and turn into Purple balls (representing long-wave radiation as the Earth absorbed the short-wave radiation and then emitted an equal quantity of long-wave radiation). The scale would read "1" unit.

If there was no Atmosphere, or if the Atmosphere contained no "Greenhouse" gases to obstruct the flight of the Purple balls, they would fly out towards Space.

I then imagined the Atmosphere as an obstacle that absorbed the Purple balls, split them in two, and emitted half of the smaller balls to Space and the other half back towards the Earth. The balls going towards Earth would be absorbed, further heating the Earth, and the warmed Earth would emit them back towards the Atmosphere. The process would be repeated with the balls being absorbed by "Greenhouse" gases in the Atmosphere, and then emitted with half going out to Space, and half back to the Earth. The sum of 1 + 1/2 + 1/4 + 1/8 +1/16 ... = 2 (approximately), so the scale reads "2" units.

Thus, in my simplified analogy, the "Greenhouse" gases in the "Atmosphere" cause the scale reading to double. So, the Atmospheric "Greenhouse" Effect causes the Earth Surface to be warmer than it would be absent the "Greenhouse" gases. I think Einstein would be pleased!  Read more detail at WUWT, including the 340 responses (comments received and my brilliant replies!)...,

2 - Atmospheric Windows

A real greenhouse has windows. So does the Atmospheric “greenhouse effect”. They are similar in that they allow Sunlight in and restrict the outward flow of thermal energy. However, they differ in the mechanism. A real greenhouse primarily restricts heat escape by preventing convection while the “greenhouse effect” heats the Earth because “greenhouse gases” (GHG) absorb outgoing radiative energy and re-emit some of it back towards Earth.
There are two main “windows” in the Atmospheric “greenhouse effect”. The first, the Visible Light Window, on the left side of the graphic, allows visible and near-visible light from the Sun to pass through with small losses, and the second, the Longwave Window, on the right, allows the central portion of the longwave radiation band from the Earth to pass through with small losses, while absorbing and re-emitting the left and right portions.
Sunlight Energy In = Thermal Energy Out
The graphic is an animated depiction of the Atmospheric “greenhouse effect” process.

On the left side:
(1) Sunlight streams through the Atmosphere towards the surface of the Earth.
(2) A portion of the Sunlight is reflected by clouds and other high-albedo surfaces and heads back through the Atmosphere towards Space. The remainder is absorbed by the Surface of the Earth, warming it.
(3) The reflected portion is lost to Space.
On the right side:
(1) The warmed Earth emits longwave radiation towards the Atmosphere. According to the first graphic, above, this consists of thermal energy in all bands ~7μ, ~10μ, and ~15μ.
(2) The ~10μ portion passes through the Atmosphere with litttle loss. The ~7μ portion gets absorbed, primarily by H2O, and the 15μ portion gets absorbed, primarily by CO2 and H2O. The absorbed radiation heats the H2O and CO2 molecules and, at their higher energy states, they collide with the other molecules that make up the air, mostly nitrogen (N2), oxygen (O2), ozone (O3), and argon (A) and heat them by something like conduction. The molecules in the heated air emit radiation in random directions at all bands (~7μ, ~10μ, and ~15μ). The ~10μ photons pass, nearly unimpeded, in whatever direction they happen to be emitted, some going towards Space and some towards Earth. The ~7μ and ~15μ photons go off in all directions until they run into an H2O or CO2 molecule, and repeat the absorption and re-emittance process, or until they emerge from the Atmosphere or hit the surface of the Earth.
(3) The ~10μ photons that got a free-pass from the Earth through the Atmosphere emerge and their energy is lost to Space. The ~10μ photons generated by the heating of the air emerge from the top of the Atmosphere and their energy is lost to Space, or they impact the surface of the Earth and are re-absorbed. The ~7μ and ~15μ generated by the heating of the air also emerge from the top or bottom of the Atmosphere, but there are fewer of them because they keep getting absorbed and re-emitted, each time with some transfered to the central ~10μ portion of the longwave band.
 the infrared (long-wavelength). Read more detail at WUWT, including the 489 responses (comments received and my brilliant replies!)...

3 - Emission Spectra

The Atmospheric “greenhouse effect” has been analogized to a blanket that insulates the Sun-warmed Earth and slows the rate of heat transmission, thus increasing mean temperatures above what they would be absent “greenhouse gases” (GHGs). Perhaps a better analogy would be an electric blanket that, in addition to its insulating properties, also emits thermal radiation both down and up. The graphic below, based upon actual measurements of long-wave radiation as measured by a satellite LOOKING DOWN from the Top of the Atmosphere as well as from the Surface LOOKING UP from the Bottom of the Atmmsphere, depicts the situation.
,
Description of graphic (from bottom to top):
Earth Surface: Warmed by shortwave (~1/2μ) radiation from the Sun, the surface emits upward radiation in the ~7μ, ~10μ, and ~15μ regions of the longwave band. This radiation approximates a smooth “blackbody” curve that peaks at the wavelength corresponding to the surface temperature.
Bottom of the Atmosphere: On its way out to Space, the radiation encounters the Atmosphere, in particular the GHGs, which absorb and re-emit radiation in the ~7μ and ~15μ regions in all directions. Most of the ~10μ radiation is allowed to pass through.
The lower violet/purple curve (adapted from figure 8.1 in Petty and based on measurements from the Tropical Pacific looking UP) indicates how the bottom of the Atmosphere re-emits selected portions back down towards the surface of the Earth. The dashed line represents a “blackbody” curve characteristic of 300ºK (equivalent to 27ºC or 80ºF). Note how the ~7μ and ~15μ regions approximate that curve, while much of the ~10μ region is not re-emitted downward.
“Greenhouse Gases”: The reason for the shape of the downwelling radiation curve is clear when we look at the absorption spectra for the most important GHGs: H2O, H2O, H2O, … H2O, and CO2. (I’ve included multiple H2O’s because water vapor, particularly in the tropical latitudes, is many times more prevalent than carbon dioxide.)
Note that H2O absorbs at up to 100% in the ~7μ region. H2O also absorbs strongly in the ~15μ region, particularly above 20μ, where it reaches 100%. CO2 absorbs at up to 100% in the ~15μ region.
Neither H2O nor CO2 absorb strongly in the ~10μ region.
Since gases tend to re-emit most strongly at the same wavelength region where they absorb, the ~7μ and ~15μ are well-represented, while the ~10μ region is weaker.
Top of the Atmosphere: The upper violet/purple curve (adapted from figure 6.6 in Petty and based on satellite measurements from the Tropical Pacific looking DOWN) indicates how the top of the Atmosphere passes certain portions of radiation from the surface of the Earth out to Space and re-emits selected portions up towards Space. The dashed line represents a “blackbody” curve characteristic of 300ºK. Note that much of the ~10μ region approximates a 295ºK curve while the ~7μ region approximates a cooler 260ºK curve. The ~15μ region is more complicated. Part of it, from about 17μ and up approximates a 260ºK or 270ºK curve, but the region from about 14μ to 17μ has had quite a big bite taken out of it. Note how this bite corresponds roughly with the CO2 absorption spectrum.
See more graphics and detail at WUWT, including the 476 responses (comments received and my brilliant replies!)...

4 - Molecules and Photons

In this part, we consider the interaction between air molecules, including Nitrogen (N2), Oxygen (O2), Water Vapor (H2O) and Carbon Dioxide (CO2), with Photons of various wavelengths. This may help us visualize how energy, in the form of Photons radiated by the Sun and the Surface of the Earth, is absorbed and re-emited by Atmospheric molecules.

The animated graphic has eight frames, as indicated by the counter in the lower right corner. Molecules are symbolized by letter pairs or triplets and Photons by ovals and arrows. The view is of a small portion of the cloud-free Atmosphere.
  1. During the daytime, Solar energy enters the Atmosphere in the form of Photons at wavelengths from about 0.1μ (micron – millionth of a meter) to 4μ, which is called “shortwave” radiation and is represented as ~1/2μ and symbolized as orange ovals. Most of this energy gets a free pass through the cloud-free Atmosphere. It continues down to the Surface of the Earth where some is reflected back by light areas (not shown in the animation) and where most is absorbed and warms the Surface.
  2. Since Earth’s temperature is well above absolute zero, both day and night, the Surface radiates Photons in all directions with the energy distributed approximately according to a “blackbody” at a given temperature. This energy is in the form of Photons at wavelengths from about 4μ to 50μ, which is called “longwave” radiation and is represented as ~7μ, ~10μ, and ~15μ and symbolized as violet, light blue, and purple ovals, respectively. The primary “greenhouse” gases (GHG) are Water Vapor (H2O) and Carbon Dioxide (CO2). The ~7μ Photon is absorbed by an H2O molecule because Water Vapor has an absorption peak in that region, the ~10μ Photon gets a free pass because neither H2O nor CO2 absorb strongly in that region, and one of the 15μ Photons gets absorbed by an H2O molecule while the other gets absorbed by a CO2 molecule because these gases have absorption peaks in that region.
  3. The absorbed Photons raise the energy level of their respective molecules (symbolized by red outlines).
  4. The energized molecules re-emit the Photons in random directions, some upwards, some downwards, and some sideways. Some of the re-emitted Photons make their way out to Space and their energy is lost there, others back down to the Surface where their energy is absorbed, further heating the Earth, and others travel through the Atmosphere for a random distance until they encounter another GHG molecule.
  5. This frame and the next two illustrate another way Photons are emitted, namely due to collisions between energized GHG molecules and other air molecules. As in frame (2) the Surface radiates Photons in all directions and various wavelengths.
  6. The Photons cause the GHG molecules to become energized and they speed up and collide with other gas molecules, energizing them. NOTE: In a gas, the molecules are in constant motion, moving in random directions at different speeds, colliding and bouncing off one another, etc. Indeed the “temperature” of a gas is something like the average speed of the molecules. In this animation, the gas molecules are fixed in position because it would be too confusing if they were all shown moving and because the speed of the Photons is so much greater than the speed of the molecules that they hardly move in the time indicated.
  7. The energized air molecules emit radiation at various wavelengths and in random directions, some upwards, some downwards, and some sideways. Some of the re-emitted Photons make their way out to Space and their energy is lost there, others back down to the Surface where their energy is absorbed, further heating the Earth, and others travel through the Atmosphere for a random distance until they encounter another GHG molecule.
  8. Having emitted the energy, the molecules cool down.
Read more detail at WUWT, including the 743 responses (comments received and my brilliant replies!)...

5 - Light and Heat

Solar “light” radiation in = Earth “heat” radiation to Space out! That’s old news to those of us who understand all energy is fungible (may be converted to different forms of energy) and energy/mass is conserved (cannot be created nor destroyed).
My Visualizing series [Physical Analogy, Atmospheric Windows, Emission Spectra, and Molecules/Photons] has garnered almost 2000 comments, mostly positive. I’ve learned a lot from WUWT readers who know more than I do. However, some commenters seem to have been taken in by scientific-sounding objections to the basic science behind the Atmospheric “Greenhouse Effect”. Their objections seemed to add more heat than light to the discussion. This posting is designed to get back to basics and perhaps transform our heated arguments into more enlightened understanding :^)

Solar "light" energy in is equal to Earth "heat" energy out.
Read more detail at WUWT, including the 958 responses (comments received and my brilliant replies!)...

ANSWERING THREE OBJECTIONS TO BASIC ATMOSPHERIC “GREENHOUSE EFFECT” SCIENCE

First of all, let me be clear where I am coming from. I’m a Lukewarmer-Skeptic who accepts that H2O, CO2 and other so-called “greenhouse gases” in the Atmosphere do cause the mean temperature of the Earth Surface and Atmosphere to be higher than they would be if everything was the same (Solar radiation, Earth System Albedo, …) but the Atmosphere was pure nitrogen.

The main scientific question for me, is how much does the increase in human-caused CO2 and human-caused albedo reduction increase the mean temperature above what it would be with natural cycles and processes? My answer is “not much”, because perhaps 0.1ºC to 0.2ºC of the supposed 0.8ºC increase since 1880 is due to human activities. The rest is due to natural cycles and processes over which we humans have no control. The main public policy question for me, is how much should we (society) do about it? Again, my answer is “not much”, because the effect is small and a limited increase in temperatures and CO2 may turn out to have a net benefit.

So, my motivation for this Visualizing series is not to add to the Alarmist “the sky is falling” panic, but rather to help my fellow Skeptics avoid the natural temptation to fall into an “equal and opposite” falsehood, which some of those on my side, who I call “Disbelievers”, do when they fail to acknowledge the basic facts of the role of H2O and CO2 and other gases in helping to keep temperatures in a livable range.

Objection #1: Visual and near-visual radiation is merely “light” which lacks the “quality” or “oomph” to impart warmth to objects upon which it happens to fall.

Answer #1: A NASA webpage targeted at children is sometimes cited because they say the near-IR beam from a TV remote control is not warm to the touch. Of course, that is not because it is near-visual radiation, but rather because it is very low power. All energy is fungible, and can be changed from one form to another. Thus, the 240 Watts/m^2 of visible and near-visible Solar energy that reaches and is absorbed by the Earth System, has the effect of warming the Earth System exactly as much as an equal number of Watts/m^2 of “thermal” mid- and far-IR radiation.

Objection #2: The Atmosphere, which is cooler than the Earth Surface, cannot warm the Earth Surface.

Answer #2: The Second law of Thermodynamics is often cited as the source of this falsehood. The correct interpretation is that the Second Law refers to net warming, which can only pass from the warmer to the cooler object. The back-radiation from the Atmosphere to the Earth Surface has been measured (see lower panel in the above illustration). All matter above absolute zero emits radiation and, once emitted, that radiation does not know if it is travelling from a warmer to a cooler surface or vice-versa. Once it arrives it will either be reflected or absorbed, according to its wavelength and the characteristics of the material it happens to impact.

Objection #3: The Atmospheric “Greenhouse Effect” is fictional. A glass greenhouse works mainly by preventing or reducing convection and the Atmosphere does not work that way at all.

Answer #3: I always try to put “scare quotes” around the word “greenhouse” unless referring to the glass variety because the term is misleading. Yes, a glass greenhouse works by restricting convection, and the fact that glass passes shortwave radiation and not longwave makes only a minor contribution.

Thus, I agree it is unfortunate that the established term for the Atmospheric warming effect is a bit of a misnomer. However, we are stuck with it. But, enough of semantics. Notice that the Earth System mean temperature I had to use to provide 240 Watts/m^2 of radiation to Space to balance the input absorbed from by the Earth System from the Sun was 255 K. However, the actual mean temperature at the Surface is closer to 288 K. How to explain the extra 33 K (33ºC or 58ºF)? The only rational explanation is the back-radiation from the Atmosphere to the Surface.

Ira Glickstein

Tuesday, November 30, 2010

CLEAN Coal! (Say WATT?)

The December 2010 issue of the Atlantic shows an amazing turn-around by the Global Warming alarmists! Yes, they are still alarmed and predicting imminent climate change disaster, but ...

BUT, they have reversed themselves on their previous 'ol devil coal! (This follows their equally sharp reversal on nuclear energy over the past few years.)

Turns out we need coal to generate Watts of electricity for our electric cars and, they say, we can do it in a way that is environmentally correct.

The cover story, by respected author James Fallows, is titled Why the Future of Clean Energy is Dirty Coal. {Click the link to read it free online.}


"To environmentalists, 'clean coal' is an insulting oxymoron. But for now, the only way to meet the world’s energy needs, and to arrest climate change before it produces irreversible cataclysm, is to use coal—dirty, sooty, toxic coal— ..."

Recall that, only last year, a leading alarmist, NASA's James Hansen, one of the key science advisors on Al Gore's The Inconvenient Truth movie, wrote:


"..coal is the single greatest threat to civilization and all life on our planet. ... The dirtiest trick that governments play on their citizens is the pretense that they are working on “clean coal”..." and "The trains carrying coal to power plants are death trains. Coal-fired power plants are factories of death."
Amazingly, while atmospheric CO2 is still the bogeyman of what alarmists say is an imminent Global Warming disaster, coal, which is nearly all carbon and generates CO2 when burned as intended, is part of the solution! Fallows writes:


Before James Watt invented the steam engine in the late 1700s—that is, before human societies had much incentive to burn coal and later oil in large quantities—the concentration of carbon dioxide in the atmosphere was around 280 parts per million, or ppm ... By 1900, as Europe and North America were industrializing, it had reached about 300 ppm.

Now the carbon-dioxide concentration is at or above 390 ppm, which is probably the highest level in many millions of years. “We know that the last time CO2 was sustained at this level, much of the Greenland and West Antarctic ice sheets were not there,” Michael Mann, a climate scientist at Penn State, told me. Because of the 37 billion annual tons of carbon-dioxide emissions, the atmospheric carbon-dioxide level continues to go up by about two ppm a year. For perspective: by the time today’s sixth-graders finish high school, the world carbon-dioxide level will probably have passed 400 ppm, and by the time most of them are starting families, it will have entered the 420s. ...

Michael Mann told me. “What we have with rising CO2 levels in general is a dramatically increasing probability of serious and deleterious change in our climate.” He went down the list: more frequent, severe, and sustained heat waves, like those that affected Russia and the United States this summer; more frequent and destructive hurricanes and floods; more frequent droughts, like the “thousand-year drought” that has devastated Australian agriculture; and altered patterns of the El Niño phenomenon, which will change rainfall patterns in the Americas. ...
You should recognize Michael Mann as the creator of the deceptive "hockey stick curve" at the center of many of the Climategate emails. (See this and this and this and this.)

So, what is the solution? Fallows writes:


Isn’t “clean energy” the answer? Of course—because everything is the answer. The people I spoke with and reports I read differed in emphasis, sometimes significantly. Some urged greater stress on efficiency and conservation; some, a faster move toward nuclear power or natural gas; some, an all-out push for solar power and other renewable sources ...

“Emotionally, we would all like to think that wind, solar, and conservation will solve the problem for us,” David Mohler of Duke Energy told me. “Nothing will change, our comfort and convenience will be the same, and we can avoid that nasty coal. Unfortunately, the math doesn’t work that way.”...

Coal will be with us because it is abundant: any projected “peak coal” stage would come many decades after the world reaches “peak oil.” It will be with us because of where it’s located: the top four coal-reserve countries are the United States, Russia, China, and India, which together have about 40 percent of the world’s population and more than 60 percent of its coal. ...

“I know this is a theological issue for some people,” Julio Friedmann of Lawrence Livermore said. “Solar and wind power are going to be important, but it is really hard to get them beyond 10 percent of total power supply.” ...

What would progress on coal entail? The proposals are variations on two approaches: ways to capture carbon dioxide before it can escape into the air and ways to reduce the carbon dioxide that coal produces when burned. In “post-combustion” systems, the coal is burned normally, but then chemical or physical processes separate carbon dioxide from the plume of hot flue gas that comes out of the smokestack. Once “captured” as a relatively pure stream of carbon dioxide, this part of the exhaust is pressurized into liquid form and then sold or stored. ...

“Pre-combustion” systems are fundamentally more efficient. In them, the coal is treated chemically to produce a flammable gas with lower carbon content than untreated coal. This means less carbon dioxide going up the smokestack to be separated and stored.

Either way, pre- or post-, the final step in dealing with carbon is “sequestration”—doing something with the carbon dioxide that has been isolated at such cost and effort, so it doesn’t just escape into the air. ... All larger-scale, longer-term proposals for storing carbon involve injecting it deep underground, into porous rock that will trap it indefinitely. In the right geological circumstances, the captured carbon dioxide can even be used for “enhanced oil recovery,” forcing oil out of the porous rock into which it is introduced and up into wells.
According to Fallows, China is in the lead on this clean coal technology, with help from American and other western corporations. While it is good that at least some of the Global Warming alarmists are warming up to coal as a necessary part of the solution, it would be better IMHO, if they were also more realistic about the actual dangers of climate change and the likelihood (again IMHO) that most of the warming of the past century is due to natural cycles not under human control and that we are likely already in a multi-decade period of stable temperatures, and perhaps a bit of cooling.

Yes, I think we need to do something about the unprecedented steady rise in CO2 levels, but we have to do it is a way that will not destroy our economies or force us to drastically reduce our lifestyles. One thing I agree with James Hansen about is that an across-the-board carbon tax, assessed equally against all sequestered fuels (coal, oil, natural gas) and collected at the mine, well, or port, is the best solution, far more suitable to the task than the "cap and trade" political scam, and more likely to work.

Rather than have governments pick winners (and mess up as they did with corn ethanol subsidies that raised food prices and reduced gas mileage without doing much to control CO2 emissions) I prefer to tax carbon progressively a bit more each year and let industry and other users decide for themselves how to adapt to the higher prices. Nothing stimulates action and invention like saving your own money. Nothing wastes money like government taking money from "Mr. A" and giving it to "Mr. B" for the "good of society".

***************************

Another story in the same issue of the Atlantic is about famed physicist Freeman Dyson and The Danger of Cosmic Genius.{Click the link to read it free online.}

They write:
In the range of his genius, Freeman Dyson is heir to Einstein—a visionary who has reshaped thinking in fields from math to astrophysics to medicine, and who has conceived nuclear-propelled spaceships designed to transport human colonists to distant planets. And yet on the matter of global warming he is, as an outspoken skeptic, dead wrong: wrong on the facts, wrong on the science. How could someone as smart as Dyson be so dumb about the environment?
Does it occur to them that the Global Warming alarmists may be the ones who are wrong?


Ira Glickstein

Saturday, May 1, 2010

Deep Water Horizon Oil Rig Disaster

The photo on the left shows the ill-fated Deep Water Horizon oil rig prior to the recent disaster. On the right, you can see what the lower part of a deep water rig looks like. In this case is it a sister rig, the Nautilus, being transported by a heavy-lift ship. [Click on photo for larger image.]

See more photos and information at WattsUpWithThat.

There has been lots of information and quite a bit of mis-information about the April 20th explosion and the release of millions of gallons of crude oil into the Gulf of Mexico. Prior to reading the linked source above, I had the impression these rigs are tethered to the bottom and that the Horizon had safety features that were inferior to more modern offshore rigs. Both of these impressions appear to be false.

"The rig represents the cutting edge of drilling technology. It is a floating rig, capable of working in up to 10,000 ft water depth. The rig is not moored; It does not use anchors because it would be too costly and too heavy to suspend this mooring load from the floating structure. Rather, a triply-redundant computer system uses satellite positioning to control powerful thrusters that keep the rig on station within a few feet of its intended location, at all times. This is called Dynamic Positioning."

Someone told me this rig did not have an automatic shut-off in case of an accident. That is also incorrect.

"With a floating drilling rig setup, because it moves with the waves, currents, and winds, all of the main pressure control equipment sits on the seabed – the uppermost unmoving point in the well. This pressure control equipment – the Blowout Preventers, or ‘BOP’s' as they’re called, are controlled with redundant systems from the rig. In the event of a serious emergency, there are multiple Panic Buttons to hit, and even fail-safe Deadman systems that should be automatically engaged when something of this proportion breaks out. None of them were aparently activated, suggesting that the blowout was especially swift to escalate at the surface."

Far from reassuring me that this accident was preventable with better safety equipment -or at least that the resultant large spill could have been avoided- , it now seems to me that even the best offshore drilling technology is likely to result in occasional disasters. When human beings are involved there will always be mistakes and accidents that overwhelm any supposed fail-safe system.

If I lived along the shorelines of Lousiana or Mississippi or Texas where many rigs currently operate, or along the Florida coast where President Obama recently authorized drilling (since suspended), I would be very, very worried. If I was invested in the commercial fishing industry or in beach-related tourism, or employed there, I would try to get out.

I have been on the "drill baby drill" bandwagon for some time but this disaster has me thinking about getting off.

Baring a loss of pressure or the sudden self-sealing of the leak, it will be weeks or months before the oil stops leaking.

"In the coming weeks they will move in at least one other rig to drill a fresh well that will intersect the blowing one at its pay zone. They will use technology that is capable of drilling from a floating rig, over 3 miles deep to an exact specific point in the earth – with a target radius of just a few feet plus or minus. Once they intersect their target, a heavy fluid will be pumped that exceeds the formation’s pressure, thus causing the flow to cease and rendering the well safe at last. It will take at least a couple of months to get this done, bringing all available technology to bear."

So, here I sit in Central Florida, an hour from either the Gulf or the Atlantic coastline, trying to balance higher fuel bills for myself if we don't drill vs authorizing more domestic drilling and endangering the livelihoods and investments of coastal employees and investors. An alternative would be continued dependence on foreign oil but that comes with a cost in American blood to protect that access.

Then there is nuclear power with attendant risks of terrorist attack or accidental release of radiation, plus the problem of nuclear waste. France has done quite well, so far, with nuclear, but, even if we go whole hog down that road, it will be decades before nuclear can impact our need for traditional energy sources.

Wind, solar, water, tides and other alternative clean energy sources are -at least now- inadequate to make much of an impact on our appetite for energy. Conservation is also good I tell myself as I do 40-50 miles per week on my bicycle and ride around in my electric golf cart and hybrid Prius, but it too is inadequate to save much energy.

Finally, there is coal, and the possibility of what President Obama calls "clean coal technology". The US has lots of coal. The problem is continued release of CO2 and worries about continuing global warming due to the "greenhouse" effect. Let us hope that we skeptics and lukewarmers are correct that the dangers of CO2 have been overblown and that the recent stabilization in global temperatures, and perhaps a bit of global cooling, will hang on for a while.

Ira Glickstein

Friday, February 26, 2010

Atmospheric Science Made Simple

Here's a neat way to understand the issue of CO2 "saturation" in the atmosphere as well as the general mechanism of the "Greenhouse effect" and whether or not water vapor has a positive or negative feedback when it comes to Global Warming. You can download the PowerPoint Show with the atmospheric science part of my presentation to the Philo Club at The Villages, FL, along with an audio narrative, here. That show with a script is here. You can also download the PowerPoint Show with my complete talk contrasting Cap&Trade with a Revenue-Neutral Carbon Tax here.

The above chart shows the absorption spectrum for CO2, assuming levels from 100 ppmv (lowest level of CO2 in the ice core record) to 200 ppmv to pre-industrial levels of about 300 ppmv to current levels of around 400 ppmv and projecting up to 500 ppmv which is where we will be in around 50 years unless we curb our carbon emissions or the Earth cools a bit.

The "hot pink" area around 10μ is where the Earth's long wave infrared radiation peaks. Notice that going from 100 ppmv to 200 ppmv almost doubles the amount of absorptivity, and increasing CO2 to 300 ppmv almost triples it. However, at 300 ppmv, the 15μ band is 100% absorbed, so increasing to 400 ppmv has little additional effect as does further increase to 500 ppmv. I have never seen "CO2 saturation" presented this way. [Get an animated version with audio narration here.]

The above chart shows how the "Greenhouse Effect" works. Rays from the Sun that strike light-colored surfaces reflect the energy back to space. Rays that strike dark-colored surfaces are absorbed, warming the Earth. Warm surfaces emit all wavelengths in all directions. Some rays pass through the atmosphere back to space. Others are absorbed by CO2 gasses that re-radiate in all directions. Radiation that comes back and warms the Earth is called the “Greenhouse Effect”. [Get an animated version with audio narration here.]

The effect of water vapor in the atmosphere is controversial. IPCC models assume it has a positive feedback effect, meaning the more water vapor in the atmosphere, the more warming. Others, including me, believe the net effect of water vapor is negative, moderating warming.

The above chart tells why. All clouds do warm the earth according to the "Greenhouse Effect". In fact, for night clouds, that is the only effect. However, there are fewer night clouds and the Earth is cooler at night, so the warming effect is moderated. Daylight clouds also warm the Earth a bit by the "Greenhouse Effect", but they also reflect incomming Sunlight back to space and cast a cooling umbra on the Earth. The net effect of daylight clouds is therefore cooling. Rain, snow, thunderstorms, wind, convection and so on also have a net cooling effect. AAs we all know, clouds are formed when water evaporates from the surface of the warm Earth. The "heat of vaporization" removes heat from the Earth and the warmed water vapor takes it higher up in the atmosphere. When water vapor condenses to droplets, the "heat of condensation" (equal to the "heat of vaporization") releases the heat into the clouds where some escapes by radiation to space, a net cooling effect. Some radiation comes back to Earth as "Greenhouse Effect". Thunderstorms suck warmed air from the surface to high up in the atmosphere, returning cooler air, a net cooling effect. Rain or snow cools the Earth when it falls to the surface.

Therefore, it is reasonable to believe that water vapor, the key element along with the Sun in driving weather, has a generally net cooling effect. Thus, the fact that more water is evaporated as the Earth warms, has a negative feedback, and moderates Global Warming. [Get an animated version with audio narration here.]

Ira Glickstein

Wednesday, January 13, 2010

Explaining Away Climategate - 4

See the detailed timeline for Climategate, posted at ClimateAudit yesterday, and my previous postings on Climategate: Original posting, Part 1, Part 2, and Part 3.


Although VP Al Gore has had no direct part in the recent Climategate controversy, it was his 2006 movie An Inconvenient Truth that most activated the ALARMISTs, outraged the DENIERs, and animated the reaction by the Skeptics.

When I watched Gore's impressive movie several years ago, I was most struck by the scene in the above photo [Click it for a larger version - The base photo is from the movie, the annotations are mine.]

Tuesday, January 5, 2010

Explaining Away Climategate - 3


Climategate was triggered by the release of thousands of emails and computer programs from the UK Climactic Research Unit (CRU) late in 2009. See the video attempt at Explaining Away Climategate for a defence of the Warmists. This is the third of my series. See Part 1 and part 2.

Even the IPCC has admitted the truth of the Medieval Warming Period (MWP). See the image above that appeared in their 1990 report, indicating that temperatures between 1100 and 1300 were higher than the most recent decades. [I added the red annotation - more about that below.]

Friday, January 1, 2010

Explaining Away Climategate - 2

Climategate was triggered by the release of thousands of emails and computer programs from the UK Climactic Research Unit (CRU) late in 2009. See the video attempt at Explaining Away Climategate for a defence of the Warmists.

This is the second of a series of new Topic postings that detail the viewpoints of the major groups involved in the controversy. See first part here.

Wednesday, December 30, 2009

Explaining Away Climategate - 1


Climategate
was triggered by the release of thousands of emails and computer programs from the UK Climactic Research Unit (CRU) late in 2009. See Jon Stewart's hilarious and surprisingly fact-filled take and this attempt at Explaining Away Climategate.

This is the first of a series of new Topic postings that detail the viewpoints of the major groups involved in the controversy:

Monday, October 12, 2009

BBC NEWS: What Happened to Global Warming?

OK, if you don't trust me on Global Warming, how about the good old BBC NEWS? (09 Oct 2009).

**********************************

"What happened to global warming?

"By Paul Hudson
"Climate correspondent, BBC News

"This headline may come as a bit of a surprise, so too might that fact that the warmest year recorded globally was not in 2008 or 2007, but in 1998.

"But it is true. For the last 11 years we have not observed any increase in global temperatures.

"And our climate models did not forecast it, even though man-made carbon dioxide, the gas thought to be responsible for warming our planet, has continued to rise.

"... last month Mojib Latif, a member of the IPCC (Intergovernmental Panel on Climate Change) says that we may indeed be in a period of cooling worldwide temperatures that could last another 10-20 years. Professor Latif is based at the Leibniz Institute of Marine Sciences at Kiel University in Germany and is one of the world's top climate modellers. But he makes it clear that he has not become a sceptic; he believes that this cooling will be temporary, before the overwhelming force of man-made global warming reasserts itself. ...

"One thing is for sure. It seems the debate about what is causing global warming is far from over. Indeed some would say it is hotting up."


**********************************************************************************************

I've been on this case for quite a while. See my postings that go back over a year.


Ira Glickstein

Wednesday, July 22, 2009

Global Warming Tiger - Ocean Carbon

This is the fourth of the series Global Warming - Tale of the Tiger.

Read the first posting in this series: Tale and a description of the figure to the left. I believe the apparent 0.8ºC increase in Global Temperature over the past 150 years is due to three major causes and one minor one, as indicated by the parts of the "tiger". (The second posting details Data Bias and the third Natural Cycles.)

OCEAN CARBON

This posting is about OCEAN CARBON that I estimate is responsible for about 20% of the apparent warming of the surface of the Earth over the past 150 years.

COMPONENTS OF ATMOSPHERIC CARBON GASSES

Atmospheric carbon gasses may be subdivided into three categories: 1) Historically normal levels, typical for the past 100,000 years or so, 2) excess carbon gasses over historically normal levels due to non-human causes, mainly the general warming of the surface of the Earth over the past 150 years, and 3) excess carbon gasses due to human activities, primarily the burning of previously sequestered carbon (coal, oil, natural gas). Although there are many carbon gasses, the following analysis centers on CO2, which is the main one.

1) What are the historically normal levels? Homo sapiens, hominids with large brains about the size of ours, have been on Earth for about 100,000 years. Humans capable of understanding and speaking metaphoric languages have been around for about 10,000 years. Industrial humans capable of having a substantial effect on atmospheric carbon have been around for only about 200 years. During the period from 100,000 to 200 years ago, according to ice core data, atmospheric CO2 gas has varied from about 180 to 280 parts per million (ppm). Thus, anything over 280 ppm is historically excessive.

2) What are the non-human-caused excess carbon levels? Current CO2 levels are about 390 ppm, which is 110 ppm in excess of the historical maximum. Of that, I believe around 70 to 80 ppm is due to the transfer of carbon from the surface of the Earth to the atmosphere, as a result of the actual global warming of about 0.5ºC over the past 150 years. I call this "ocean carbon" because most of it has fizzed out of the oceans over the past century and a half. The posting you are currently reading has to do with "ocean carbon".

3) What are the human-caused excess carbon levels? The remaining 30-40 ppm of excess CO2 in the atmosphere is due to human burning of previously sequestered carbon. The next posting in this series will detail what I call "human carbon".

THE "GREENHOUSE" EFFECT

When we were kids, we learned about the "greenhouse" effect. Visible light from the sun passes through the glass roof of the greenhouse. As this light energy floods in and illuminates the plants, soil and rocks, they heat up and emit infrared radiation. Since the infrared radiation is of a longer wavelength, it cannot pass back out through the glass, which is why (we were taught) the greenhouse heats up. Well, what we learned was true, but it turns out that the sun's heat stays within the greenhouse mostly because the side walls prevent the hot air from escaping. Nowadays you can build a good greenhouse with plastic materials that pass both visible and infrared radiation. As long as you make the building airtight it will work. On the other hand, a glass-roofed greenhouse that is not airtight will not work well.

WARMING DUE TO "GREENHOUSE GASSES"

CO2 in the atmosphere acts something like the glass roof of a greenhouse. Visible light passes through it fairly freely, but infrared radiation does not. Thus, as the level of CO2 in the atmosphere has increased from the historical maximum of about 280 ppm to the current level of about 390 ppm, more infrared radiation has been trapped in the atmosphere and the Earth has warmed considerably as a result.

I believe global warming is responsible for an actual increase of about 0.5ºC. Of that amount, about 0.1ºC to 0.2ºC is due to positive feedback from carbon gasses in the atmosphere that are in excess of historical levels and not due to human activities. This increase, which is about 20% of the apparent increase of 0.8ºC, is not under human control.

The fact that rising CO2 triggers positive feedback has led some to worry we may come to a "tipping point" where the CO2 increase triggers a temperature increase that triggers further CO2 increases and it all goes out of control. No need to worry. There is evidence that the current levels of CO2 are blocking nearly all the infrared radiation, so additional CO2 has little effect. Even doubling current levels will not cause a large increase in global warming. Beyond a certain point, if you double or triple the thickness of glass in the roof of a greenhouse, it will have little positive effect. (Consider a sun-blocking curtain on a window. If one curtain blocks, say, 90% of the sunlight, adding a second curtain will only block an additional 9%, and a third curtain less than 1% - the "Law of Dimimishing Returns".)

WHY DOES CO2 COME OUT OF THE OCEANS AS THEY WARM?

You are all familiar with the way a cold can of soda warms up and loses its "fizz" when left open on a hot day. The CO2 comes out of solution and goes into the atmosphere. That CO2 got absorbed into the soda at the factory when the cold liquid was exposed to concentrations of CO2 at high pressures.

The rate and direction of transfer of CO2 between the atmosphere and the oceans depends on many factors, mainly the concentration of CO2 in the air and water and the temperatures of the air and water. At current levels of CO2, the cold polar waters are net absorbers of CO2 from the atmosphere and the warm equatorial waters are net emitters of CO2 into the atmosphere. The temperate waters in-between either absorb or emit CO2 according to daily and seasonal temperatures.

As the Earth has warmed over the past 150 years, the colder waters have warmed a bit and therefore currently absorb a bit less carbon gasses than they did in the past. At the same time, the equatorial waters have also warmed and therefore emit a bit more carbon than in the past. The temporal waters also warmed and they absorb a bit less and emit a bit more. The result has been a net increase in atmospheric carbon of about 70-80 ppm over the past 150 years.

WHY ARE NORMAL LEVELS OF CO2 ESSENTIAL FOR LIFE ON EARTH?

Absent normal levels of CO2 in the atmosphere, the Earth would be a very cold place, unable to support life. Atmospheric CO2 is necessary for the growth of plants which obtain most of their mass from absorbtion of atmospheric carbon, creating carbohydrates and releasing oxygen into the atmosphere. Animals breathe the oxygenated air and feed on plants and digest the carbohydrates, releasing carbon dioxide and methane back into the atmosphere, where it is ingested again by the plants and so on in the carbon cycle of life.

Modest increases in atmospheric CO2 are beneficial to most plants as are moderate increases in temperature. There is NO short-term problem. However, as a conservative, I have a bias against relatively rapid change into unknown or unproven scenarios. Quite apart from global warming, I am sufficiently concerned about rapidly rising CO2 levels that I favor reasonable, concerted worldwide action, see Carbon Tax YES!, Cap and Trade NO!

CONCLUSIONS

Global warming, mostly due to natural cycles, has raised the temperature of the Earth causing the surface (mainly the oceans) to become a net emitters of CO2, responsible for about 70 - 80 ppm of the excesss atmospheric CO2 over historical levels. This naturally-caused temperature increase and resultant CO2 increase has increased the "greenhouse effect" and is responsible for about 20% of the apparent global warming we have experienced over the past 150 years. However, we are not near any "tipping point" as some of the alarmists claim.


Ira Glickstein